


-

A Grade(Environmental A, Social A+, Governance B+)
ESG ACTIVITIES AND ACHIEVEMENTS
We are practicing ESG
for a Better Tomorrow
Key Achievements
Key Indicators**Data as of 2022 from CJ Corp.
and 12 affiliates' business sites in Korea
-
1. Response to Climate Change
-
Greenhouse Gas Emissions
* Based on Scope 1+2891,036tCO2eq -
Energy Consumption
18,718TJ
-
-
2. Implementing a Circular Economy
Wastes Generated
* Based on manufacturing sites and resorts67,199tonsRecycling Rate of Wastes Generated
* Based on manufacturing sites and resorts89.95 % -
3. Enhancing ESG Value of Products, Services, and Content* Sustainable product : Plant-based product, seasoning for vegan,
low-carbon product, upcycled product, vegan-certified product,
biodegradable & compostable-certified product-
Sales of sustainable
products224.9billion KRW
-
-
4. Respecting and Protecting Human Rights
-
Number of Business Sites Inspected for Human Rights
*CJ CheilJedang, CJ Logistics, CJ ENM business sites and suppliers in Korea and abroad54 -
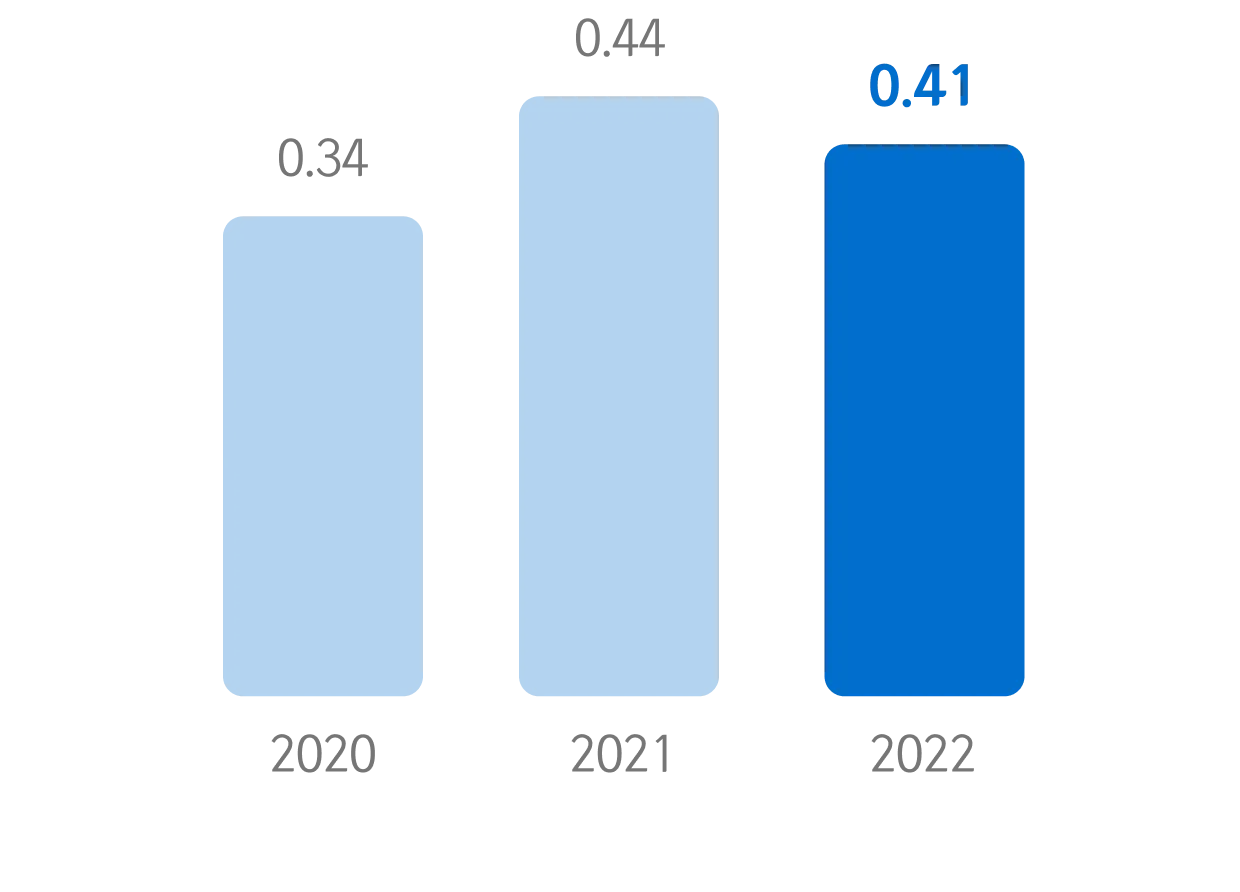
Employee Injury Rate
0.41%
-
-
5. Promoting Diversity, Equity and Inclusion (DE&I)
-
Female Executive Ratio
15.27% -
Female Manager Ratio
27.57%
-
-
6. Creating a Sustainable Supply Chain* CJ CheilJedang, CJ Logistics, CJ Freshway
-
Percentage of Contracts
Applying Supplier Code
of Conduct96.03 %
-
-
7. Strengthening Transparent Management
Independent Director
* CJ Corp
Board Composition Ratio57.14%Cash Dividend Propensity
* CJ Corp (separate basis)78.4% -
8. Expanding Ethical and Compliance Management
-
Hours Spent on Ethical
Management Training127,229hours -
Number of Employees Participating
in Ethical Management Training34,573
-
ESG Ratings**Based on 2023
Reports & PoliciesㆍRegulations
CJ Corp. ESG Report


As a holding company,
CJ Corporation sets forth the direction
and commitment for ESG management
at the group level
CJ Corporation sets forth the direction
and commitment for ESG management
at the group level
CJ Affiliates ESG Report
Policy & Regulation
Environment
-
CJ Corporation Environmental Policy
DOWNLOAD
Governance
-
CJ Corporation Corporate Governance Charter
DOWNLOAD
-
CJ Corporation Board of Directors Regulation
DOWNLOAD
-
CJ Corporation Audit Committee Regulation
DOWNLOAD
-
CJ Corporation Independent Director Candidate Recommendation Committee Regulation
DOWNLOAD
-
CJ Corporation Internal Transactions Committee Regulation
DOWNLOAD
-
CJ Corporation Compensation Committee Regulation
DOWNLOAD
-
CJ Corporation ESG Committee Regulation
DOWNLOAD
- CJ Code of Business Conduct and CJ Compliance & Ethical Management Policy
Environmental
We are laying the foundation for addressing climate change and practicing a circular economy


Key Indicators**Data as of 2022 from CJ Corp.
and 12 affiliates' business sites in Korea
Response to Climate Change
We will actively work to achieve carbon neutrality by 2050.
Greenhouse gas emissions
tCO2eq
* Based on Scope 1+2


Energy consumption
TJ


Circular Economy Practice
We will promote the transition to a circular economy system.
Wastes
generated Ton
generated Ton
* Based on manufacturing sites and resorts


Recycling rate of wastes
generated %
generated %
* Based on manufacturing sites and resorts


Expansion of ESG Value in Products, Services, and Content
We will expand the range of sustainable products.
Sales of sustainable products
in billion KRW
* Calculated from 2022
* CJ CheilJedang, CJ Feed&Care product sales
* Sustainable product : Plant-based product, seasoning for vegan, low-carbon product, upcycled product, vegan-certified product, biodegradable & compostable-certified product


Implementation System


Social
We aim to spread CJ's culture of respect throughout society


Key Indicators*
*Data as of 2022 from CJ Corp.
and 12 affiliates' business sites in Korea
Respect and Protection of Human Rights
We aim to prevent and rectify human rights violations.
Number of human
rights-related reports Cases
rights-related reports Cases
Total reports
Valid reports*
* Excluding cases where false reporting is evident, and situations where verification or investigation is unnecessary


Employee
injury rate %
injury rate %

Promoting Diversity, Equity, and Inclusion (DE&I)
We will embrace diversity and spread the values of DE&I.
Female executive ratio
%


Female manager ratio
%


Creating a Sustainable Supply Chain
We will build a fair and transparent partnershipof mutual benefit.
Percentage of contracts applying Supplier Code of Conduct
%
* CJ CheilJedang, CJ Logistics, CJ Freshway


Implementation System


| 아젠다 | 이해관계자 | |||
|---|---|---|---|---|
| 임직원 | 협력사 | 고객 | 지역사회 | |
| 채용 및 육성 | 우수인재 확보 및 육성 강화 | 인재 양성을 통한 경제적 가치 창출, 우수한 역량을 기반으로 고객 가치 제고 | ||
| 인권 | 인권경영 실행 체계 확립 | 공급망 인권 실사 | 인권경영을 통한 존중문화 확산 | |
| 다양성 ∙ 공정성 ∙ 형평성 (DE&I) | DE&I 추진을 위한 실행체계 구축 | DE&I 가치 제고를 위한 협력사 지원 | DE&I를 반영한 제품 ∙ 콘텐츠 ∙ 서비스 개발 | 사회공헌 프로그램을 통한 DE&I 가치 확산 |
| 안전 | 안전한 근무환경 구축 | 공급망 안전체계 구축 | 안전한 제품 ∙ 서비스를 통한 고객안전 확보 | 지역사회 안전 인식 제고 |
| 정보보호 | 정보보호체계 강화 | 공급망 정보보호 관리 | 고객 개인정보 관리 강화 | |
By ensuring transparent decision-making and communication, we seek to increase the trust of our stakeholders


Key Indicators*
*Data as of 2022 from CJ Corp.
and 12 affiliates' business sites in Korea
Strengthening Transparent Management
We will manage transparently and communicate continuously.
Independent director
board composition ratio %
board composition ratio %
* CJ Corp.


Cash dividend
propensity %
propensity %
* CJ Corp. (separate basis)


Expanding Ethical and Compliance Management
We conduct our business activities grounded in ethical and compliance principles.
Ethical management
training hours hours
training hours hours


participants in ethical
management training Number
of people
management training Number
of people


Implementation System


-

Grade A(Environmental A, Social A+, Governance A)
-

Grade A(Environmental A, Social A+, Governance B+)
-

Grade B+(Environmental B+, Social A+, Governance B)
-

Grade A(Environmental A, Social A+, Governance B+)
-

Grade A(Environmental B+, Social A+, Governance A)
-

Grade B+(Environmental B+, Social A, Governance B)
-

Grade B+(Environmental B+, Social A, Governance B+)
-

Grade C(Environmental D, Social C, Governance B)
CJ Corp. governance status
Board of Directors and Committee Composition
- Chairman
- Committee Members


| Name | Gender | Birth Year | Job Title | Committee Membership | Areas of Expertise | Professional background | Term of Service | ||||
|---|---|---|---|---|---|---|---|---|---|---|---|
| Audit | Independent Director Candidate Recommendation | Internal Transaction | Compensation | ESG | |||||||
| Sohn, Kyung-Shik | M | 1939 | CEO/Chairman of the BOD | Management | Bachelor of Law, Seoul National University Current President of Korea Employers Federation Current CEO of CJ Corporation Former President of the Korean Chamber of Commerce and Industry | Feb. 25, 1994 ~ Shareholders' Meeting in March 2024 | |||||
| Kim, Hong-Ki | M | 1965 | CEO | Master of Business Administration | Sogang University Current CEO of CJ Corporation | Mar. 27, 2018 ~ Shareholders' Meeting in March 2024 | |||||
| Lim, Kyung-Mook | M | 1971 | Internal Director | Management | Ph.D. in Economics, Brown University Current Head of Strategic Planning Group of CJ Corporation | Mar. 31, 2021 ~ Shareholders' Meeting in March 2024 | |||||
| Choi, Jong-Gu | M | 1957 | External Director | Finance | M.A. University of Wisconsin School of Public Policy Current Advisor at Yoon & Yang Law Firm Former Financial Services Commissioner | Mar. 29, 2023 ~ Shareholders' Meeting in March 2026 | |||||
| Kim, Yeon-Soo | M | 1963 | Independent director | Medicine | Doctor in Medicine, Seoul National University Current Professor of Medicine, Seoul National University Former President of Seoul National University Hospital | March 29, 2023 ~ Shareholders' Meeting in March 2026 | |||||
| Kim, Yeon-Geun | M | 1960 | Finance | Master of Business Administration, Seoul National University Current Advisor at Kim & Chang Law Firm Former Commissioner of NTS Seoul Regional Office | March 27, 2019 ~ Shareholders' Meeting in March 2025 | ||||||
| Han, Ae-Ra | F | 1972 | Independent director | Law | Harvard Law School Current Professor at Sungkyunkwan University Law School Former Supreme Court Judicial Researcher | March 29, 2022 ~ Shareholders' Meeting in March 2025 | |||||
Board of Directors Operation
- Approval


| Date of Meeting | Development Date | Agenda | Approval Status | Number of Directors Attended | Independent Directors' Voting Result | |||||
|---|---|---|---|---|---|---|---|---|---|---|
| Song, Hyun-seung | Yoo, Cheol-gyu | Kim, Yeon-geun | Han, Ae-ra | Kim, Yeon-soo | Choi, Jong-gu | |||||
| 1 | 2023. 02. 13 | Approval of the 70th Financial Statement and Business Report | Approved | 6 | Not Applicable | Not Applicable | ||||
| Determination of the Dividend Policy for the 2023-2025 Fiscal Years | Approved | Not Applicable | Not Applicable | |||||||
| Approval of Transactions with Stakeholders | Approved | Not Applicable | Not Applicable | |||||||
| Report on the Operation Status of the Internal Accounting Control System | Reporting | Not Applicable | Not Applicable | |||||||
| 2 | 2023. 03. 13 | Resolution to Convene the 70th Regular Shareholders' Meeting | Approved | 7 | Not Applicable | Not Applicable | ||||
| Evaluation Report on the Operation Status of the Internal Accounting Management System | Reporting | Not Applicable | Not Applicable | |||||||
| Compliance Control Standard Inspection Results Report | Reporting | Not Applicable | Not Applicable | |||||||
| 3 | 2023. 04. 10 | Appointment of Board Committee Members | Approved | 7 | Not Applicable | Not Applicable | ||||
| 4 | 2023. 05. 08 | Q1 2023 Business Performance Report | Reporting | Not Applicable | Not Applicable | |||||
| 5 | 2023. 06. 19 | Report on Financial Stability Improvement Measures of Major Subsidiaries | Reporting | Not Applicable | Not Applicable | |||||
External Auditor Status


| Corporate Name | Date of External Auditor Appointment(*) | Contract Duration | Most Recent Audit Opinion |
|---|---|---|---|
| Samil PWC Accountings | December 23, 2022 | 2023-2025 (3 years) | 2022, EY Hanyoung Accounting Firm: Fair |
Differences from KCGS Code of Best Practices for Corporate Governance


| Best practice recommendation | Implementation details |
|---|---|
| Board composition requirements | External directors must comprise over half of the Board |
| Introduction of regulations on board and committee operation and roles | Introduced |
| Disclosure of board committee activities | Disclosed |
| Compensation committee composition | Introduced (1 internal director, 4 external directors) |
| External director nomination committee composition | Comprised of 3 external directors |
| Audit committee composition | Comprised of 4 external directors (including 1 financial expert) |
| Cumulative voting system | Excluded in Articles of Association |
| Written voting system | Not introduced |
| Insurance for directors' liability for damages | Insured at company's expense |
| Disclosure of corporate governance rating | Posted on the website |
| Explanation of differences from corporate governance best practices | Posted on the website |